Ceramic sherds provide an important archaeological record of past networks of exchange of goods and ideas between the islands of the Pacific. However, to interpret this record it is necessary to know where the pottery was made. One way to help determine if pieces in a ceramic assemblage are likely to be locally produced or imported is to look at if the mineral and rock inclusions trapped in their clay match the local geology.
The islands of the Pacific have varied geology due to the differing ways in which they were formed, and this has meant that past potters have often captured the source of their materials in the ‘fabric’ of their pots. Pacific fabric types include calcareous, oceanic basaltic, andesitic arc (and post-arc), highland tectonic and dissected orogen.
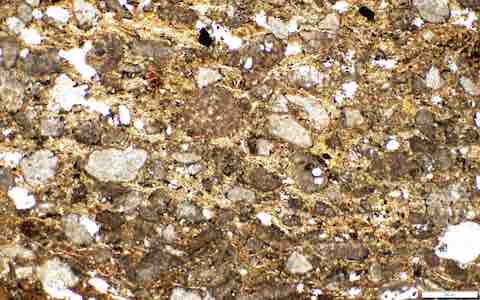
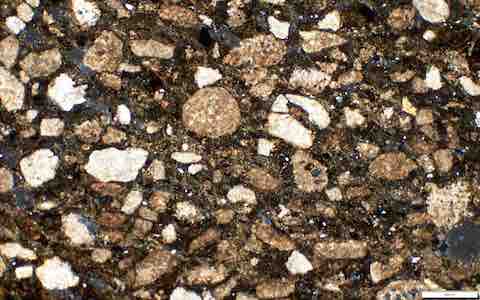
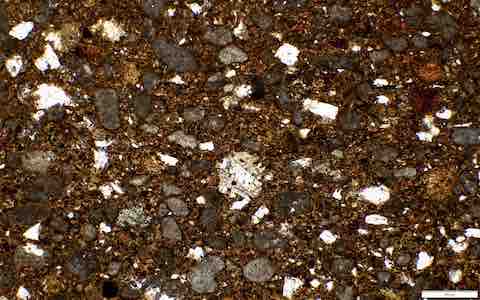
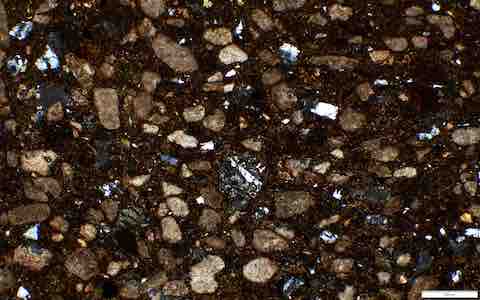
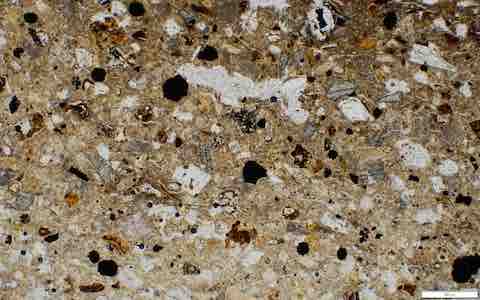
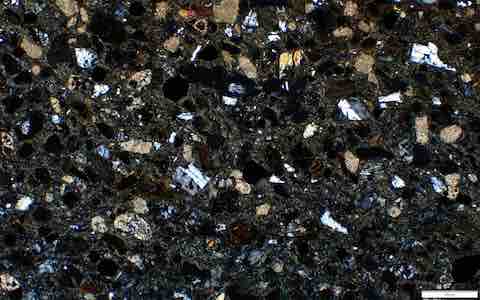
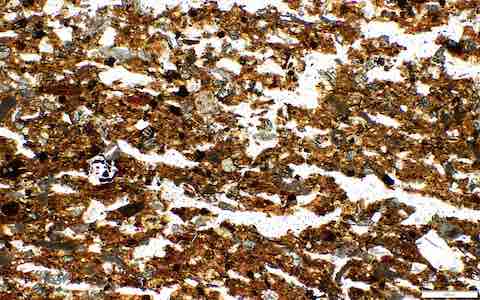
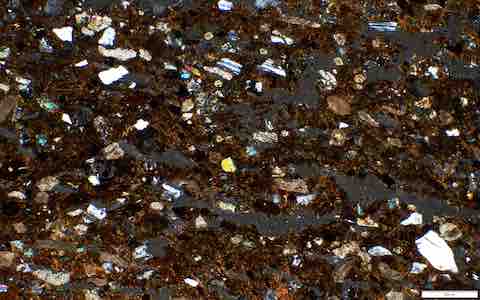
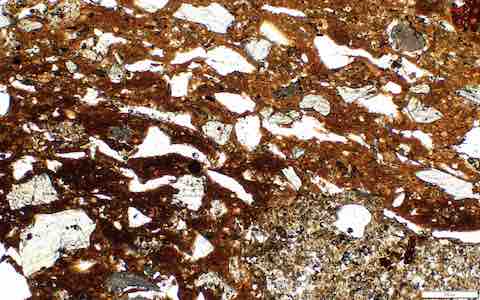
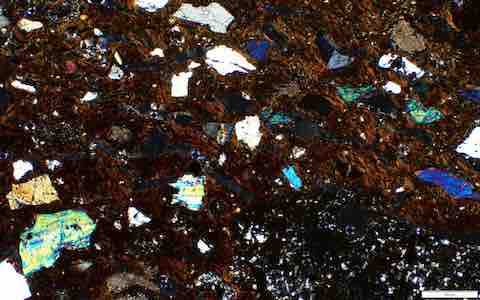
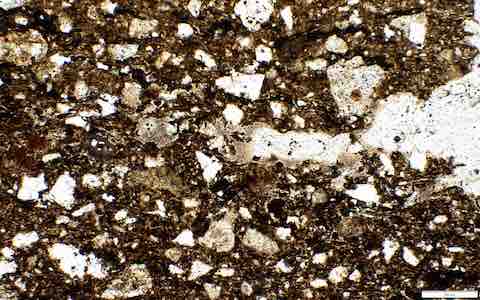
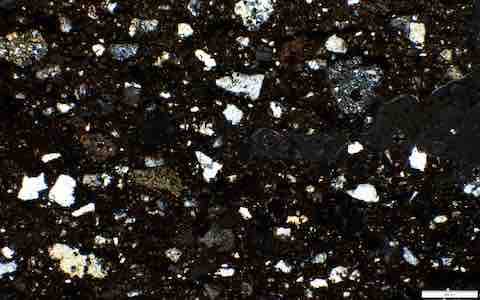
Ceramic petrography is the examination, description, and identification of these inclusions (sometimes called temper). Thin-sections (30 micron) of pottery, mounted on glass slides, can be examined under polarised light to enable their constituent minerals and rocks to be identified. This fabric database ‘kuden’, along with the image database ‘Vimipo’ were created to archive and make widely available petrographic slide descriptions and images for the Pacific region. Our aim is to create a resource for researchers (to match samples to a Pacific-wide collection), and for anyone interested geology, archaeological ceramics or the Pacific region. The databases have been seeded with slides from the extensive petrographic slide collection of the late William Dickinson, held by the Bishop Museum of Hawai’i. It is planned that it will continue to grow as new sherd assemblages are analysed. It is also envisioned that it can be connected to other databases that describe other aspects of the sherds, their appearance, dates and geochemistry, to aid in understanding the histories of the communities of the Pacific.
Kuden characterises Pacific pottery fabrics by their mineral and rock abundances in categories based on their percentage of all inclusions. See below. Fabrics have a minimum and maximum abundance.
Under 'All Fabrics', you can see the ranges for the different minerals, for each fabric. You can perform simple sorting by clicking the column name. Fabrics with whole slide images are marked '**'. Click on the fabric code to see details and images (if available).
To search for fabrics that match specified abundances, go to 'Fabric Search' and use the form. Clicking the mineral names will clarify what is included in each term. You may have to experiment with a few options. Some rock type names are especially subjective, so be try with an without specifying their presence or absence.
You can also use the 'Sites' tab to look at what fabrics are present at what locations. Locations refers to where the sherds were found and not necessarily where they were made. The 2 forms below the map, allow you to investigate individual sites, or collections of sites.
Vimipo is an Open Microscopy Environment Remote Objects (OMERO) implementation, it holds our database of images, including those made with the Zeiss AxioscanZ1. You will need to sign in as user:Guest pwd:Guest. If you reach Vimipo from a link here you will be taken straight to the viewer for that image.
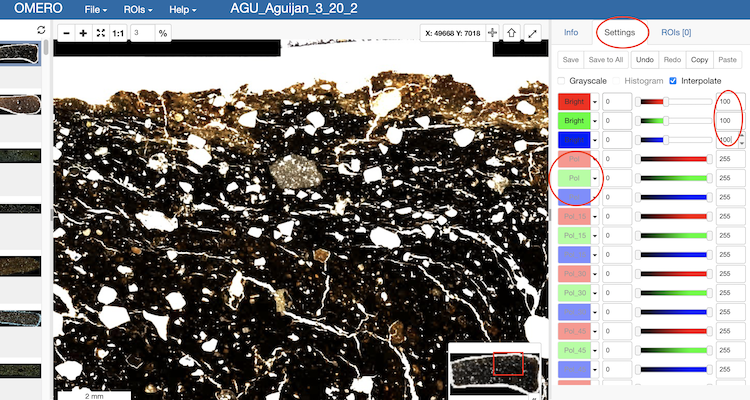
If you are viewing a whole slide image, you can turn the filters shown off and on by the clicking the Red, Green and Blue buttons that match that filter. Remember to click the previous filter off (Red, Green and Blue buttons). You can change the brightness of the image by adjusting the sliders, its strongly advisable to use the same value for the Red, Green and Blue channels. A few slides have an extra scan for PPL on 'over exposed' settings and if present this scan should be below the selected one in the thumbnail panel on the left. Some slides have a circular polarised (cPol) image, which shows the maximum brightness for all angles of XPL, but note that the brightness may be different.
If you are viewing a partial slide image, you can see the XPL version by using the vertical slider on the left. The XPL image will be at the bottom, some image stacks have a middle image which will show the PPL or XPL at a different brightness.
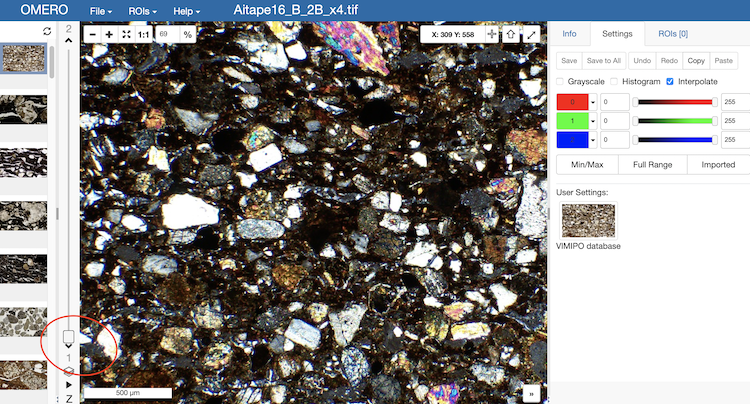
If you are viewing a partial slide image, you may be able to find other photos of the same sample by clicking on the thumbnails on the left, their names should indicate if they are the same slide.
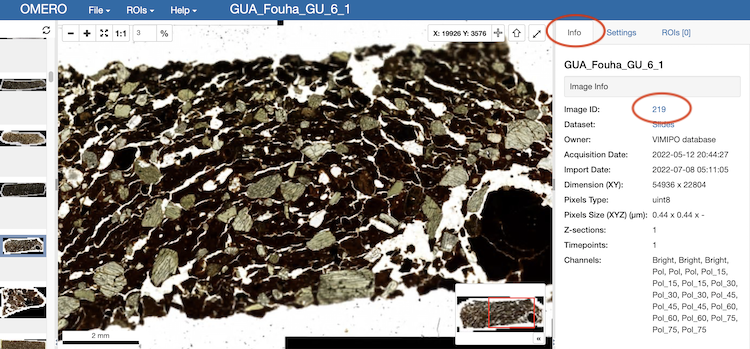
To see more information on the slide, go to 'Info' and click on the Image ID number, this should open the main site.
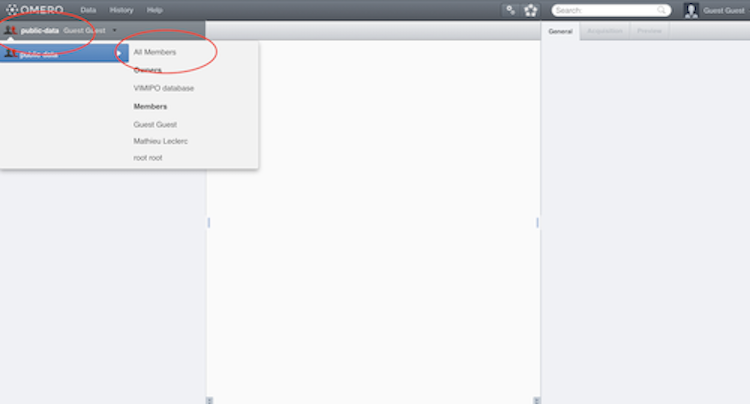
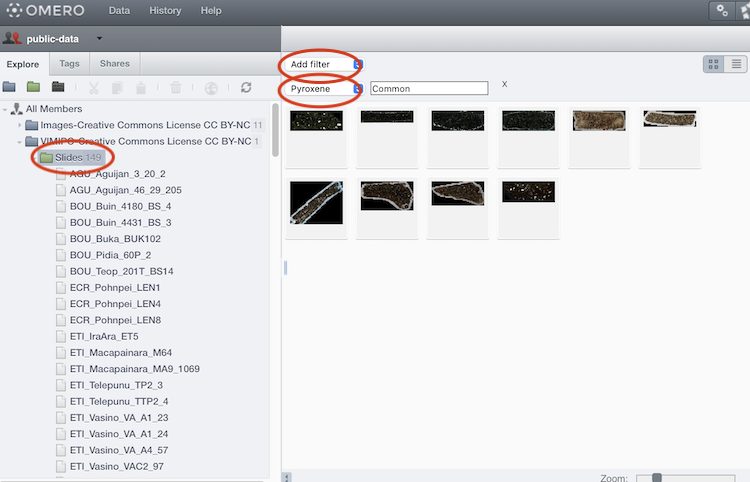
If going to the main site directly you may need to change the user (red and grey people icon near the top left) to public-data > All Members.
In the main site you can filter the images or full slides by key-value pairs, but you first have to select the folder you wish to search. Then you can 'Add Filter' and filter by keys such as slide id or mineral abundance.
For the full slide scans, the extinction angle of mineral grains can be estimated.
First determine the angle of the mineral or its cleavage plane. This must be relative to the nearest vertical or horizontal axis in an clockwise direction.
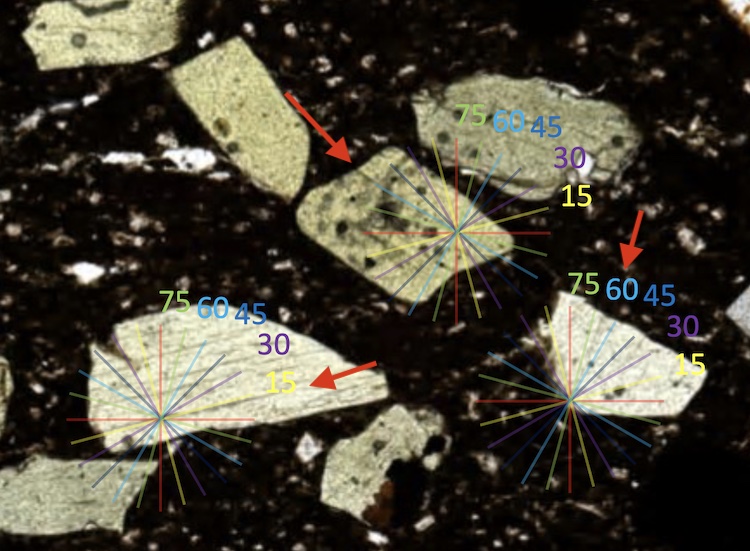
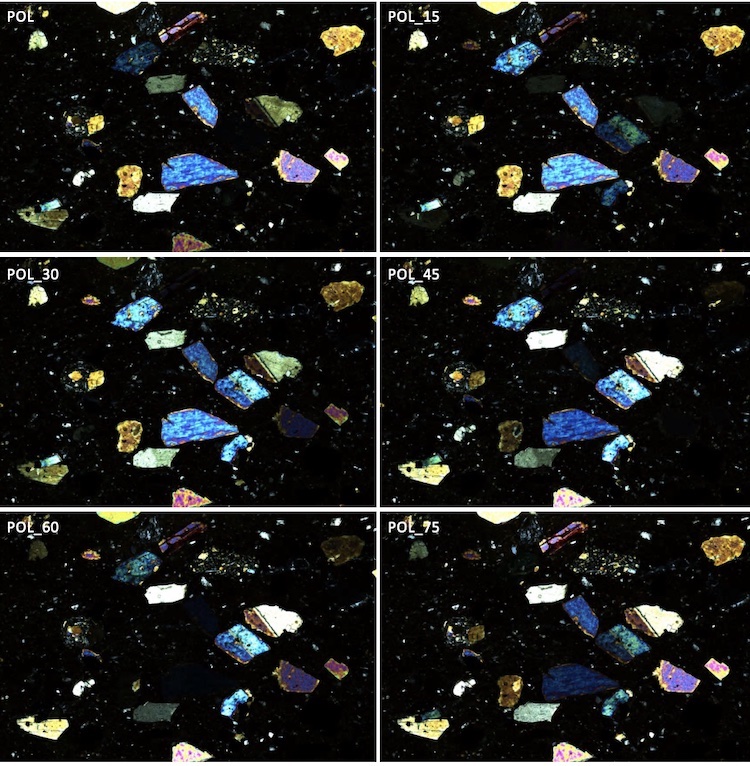
Start at the image channel that most closely matches the angle, i.e. start at POL_75 if the angle was 70°.
If the mineral is black at the start image then the extinction angle is 0°.
If the mineral of interest is not black, check the next image channel (ie POL), then the next (i.e. POL_15), then the next (i.e. POL_30). Until 'extinction' occurs. If extinction does not occur within 3 channel changes, go back to the start image and go the other way, (i.e. POL_60, then POL_45).
Each channel is 15°, so if extinction occurs after 2 channel changes, the extinction angle is 30°.
You may with to keep the origin angle offset in mind, i.e. if the measurement was 70°, and you started at POL_75, then subtract or may want to subtract 5°.
There are different approaches to classifying inclusion abundance in fabrics. Kuden characterises mineral and rock abundances by their percentage of the total inclusions, using counts. The values are generally those reported by the publication author (predominantly William Dickinson). However, while Dickinson often reported the proportions as a percent of the non-calcareous grains, everything has been standardised to be as a percent of the total. The percentages are from inclusion counts and do not reflect the size of the inclusion (i.e. a large feldspar grain could have been counted with the same consideration as a smaller opaque grain). Depending on your search aims, it may be worth searching using a few different abundances. The following is an example of different calcareous abundances.
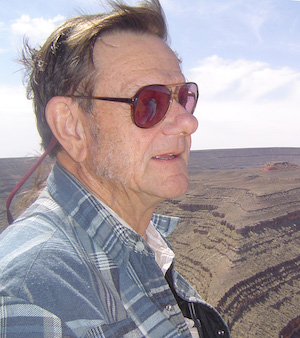
The American geoscientist William (Bill) R. Dickinson (1931-2015) was the leading petrographer for Pacific pottery. He undertook a degree in petroleum engineering at Stanford before focusing on Northwest American geology for his Masters and Doctoral work (at Stanford). Working at Stanford and the University of Arizona, he played an important role in using plate-tectonic context to classify sedimentary basins and in determining the relationship between sandstone petrology and tectonic environment. After his retirement in 1991, he researched the use of zircon to date rock deposits with scientists at the Arizona LaserChron Center.
In 1965, while still working at Stanford, he mapped volcaniclastic bedrock in Viti Levu, Fiji. He credited Fiji and his Fijian co-workers with making him a better teacher and advisor. During this time, he was asked (by Lawrence and Helen Birks) about the potential of petrography to identify the source of the Lapita pottery found at the Sigatoka Dunes on southern Viti Levi. He began collaborating with archaeologists, particularly Richard Shutler Jr, using petrography to identify the source of Pacific pottery sherds. His collaborations with archaeologists over 49 years produced at least 292 reports and over 2000 thin sections of pottery and Pacific sands. Upon his death, while researching in Tonga, his thin section collection was donated to the Bishop Museum in Hawai'i. He was buried in Nukuleka with a Tongan funeral officiated by Lord Vaea. For further information see the a biographical memoir of William Dickinson, by Jon Spencer.
If you have thin-sections or images of a fabric that we have do not have images for we would greatly appreciate you getting in touch. All providers retain reproduction rights for the donated images.
Contact us at kristine.hardy@anu.edu.au or mathieu.leclerc@anu.edu.au.
We recognise that many cultures have had their heritage investigated and sampled without their consultation. If you would like any information or images removed from the database, would like additional acknowledgements, or have found errors in the information, please contact us. Please included the slide id/s (i.e. WD_1_1) in any email with details of requested alterations.
Contact us at kristine.hardy@anu.edu.au or mathieu.leclerc@anu.edu.au.
Permission to image the thin-sections held by the Bishop Museum was conditional on the requirement that anyone seeking to reuse the images from those thin-sections for commercial gain is required to contact them for approval. Images are provided under a Creative Commons License CC BY-NC which means they can be reused for non-commercial purposes only, as long as attribution is given to the creator of the images (as specified in the kuden figure legend). If the slides have a WD_ prefix, please include W. Dickinson and mention that the slides are held at the Bishop Museum, Hawai'i.
If using information from the site please reference the origin report or publication cited. If appropriate cite this kuden as:
Hardy, K. & Leclerc, M. 2023 Kuden: A Pacific Pottery Fabric Database. www.kudenfabrics.anu.edu.au
and VIMIPO as:
Hardy, K. & Leclerc, M. 2023 VIMIPO: A Virtual Microscope for Pottery. www.kuden.anu.edu.au
Contact us at kristine.hardy@anu.edu.au or mathieu.leclerc@anu.edu.au for contact details of the thin-section providers.